For developers, few things are as frustrating as spending hours chasing elusive bugs that hide in sprawling codebases. Whether you’re a full-stack engineer debugging a microservices architecture or a game developer fine-tuning performance, pinpointing issues at breakpoints can feel like searching for a needle in a haystack. The pressure to deliver clean, efficient code under tight deadlines only amplifies this pain. Enter the AI debugging assistant for breakpoints—a game-changer that leverages artificial intelligence to detect, analyze, and resolve code issues with unprecedented precision.
Revolutionizing Debugging with AI
This article equips developers with practical, in-depth insights into seven AI-powered tools designed to tackle debugging challenges. By integrating these tools into your workflow, you can reduce debugging time, boost productivity, and deliver robust code. What is an AI debugging assistant for breakpoints? These tools use machine learning to analyze code at specific breakpoints, identify errors, and suggest fixes, transforming how developers troubleshoot. Let’s dive into how these tools address your pain points and empower your development process.
Understanding the Developer’s Debugging Pain Points
Debugging is a critical yet time-consuming part of software development. Developers often face challenges like:
- Complex Error Tracing: Bugs in large codebases, especially in microservices or multi-threaded applications, are hard to isolate.
- Time Pressures: Tight project deadlines leave little room for manual breakpoint analysis.
- Contextual Blind Spots: Traditional debugging tools lack the ability to understand project-specific logic or dependencies.
- Skill Gaps: Junior developers may struggle with interpreting stack traces or setting effective breakpoints.
These pain points lead to delayed releases, frustrated teams, and costly errors in production. A 2024 study by GitLab found that developers spend up to 25% of their time debugging, impacting project timelines and morale. AI debugging assistants for breakpoints address these issues by automating error detection, providing context-aware suggestions, and reducing reliance on manual processes.
“AI debugging tools are like having a senior developer looking over your shoulder, pointing out issues before they spiral.” – Sarah Thompson, Lead Software Engineer at TechFlow Solutions
How AI Debugging Assistants Work
AI debugging assistants for breakpoints leverage machine learning to analyze code at specific execution points, offering precise insights and actionable fixes. Here’s how developers can integrate these tools into their workflows:
How to Use an AI Debugging Assistant for Breakpoints
- Set Breakpoints Strategically: Place breakpoints in your IDE where you suspect issues or at critical execution points.
- Integrate the AI Tool: Connect the AI debugging assistant to your IDE (e.g., VS Code, IntelliJ) via plugins or APIs.
- Run the Code: Execute your program to trigger the breakpoint and allow the AI to analyze the context.
- Review AI Insights: Examine the tool’s error detection, stack trace analysis, and suggested fixes.
- Apply and Test Fixes: Implement the AI’s recommendations, then test to ensure the issue is resolved.
This process saves time by automating error detection and providing tailored solutions. For example, a developer working on a Python Flask application can use an AI tool to identify a memory leak at a breakpoint, receiving a suggestion to optimize database queries.
Unbiased Reviews of 7 AI Debugging Assistants for Breakpoints
Below, we review seven AI debugging assistants, focusing on their ability to pinpoint issues at breakpoints. Each tool is evaluated for its purpose, features, benefits, ease of use, integration, pricing, and real-world applications.
1. Workik AI Debugger
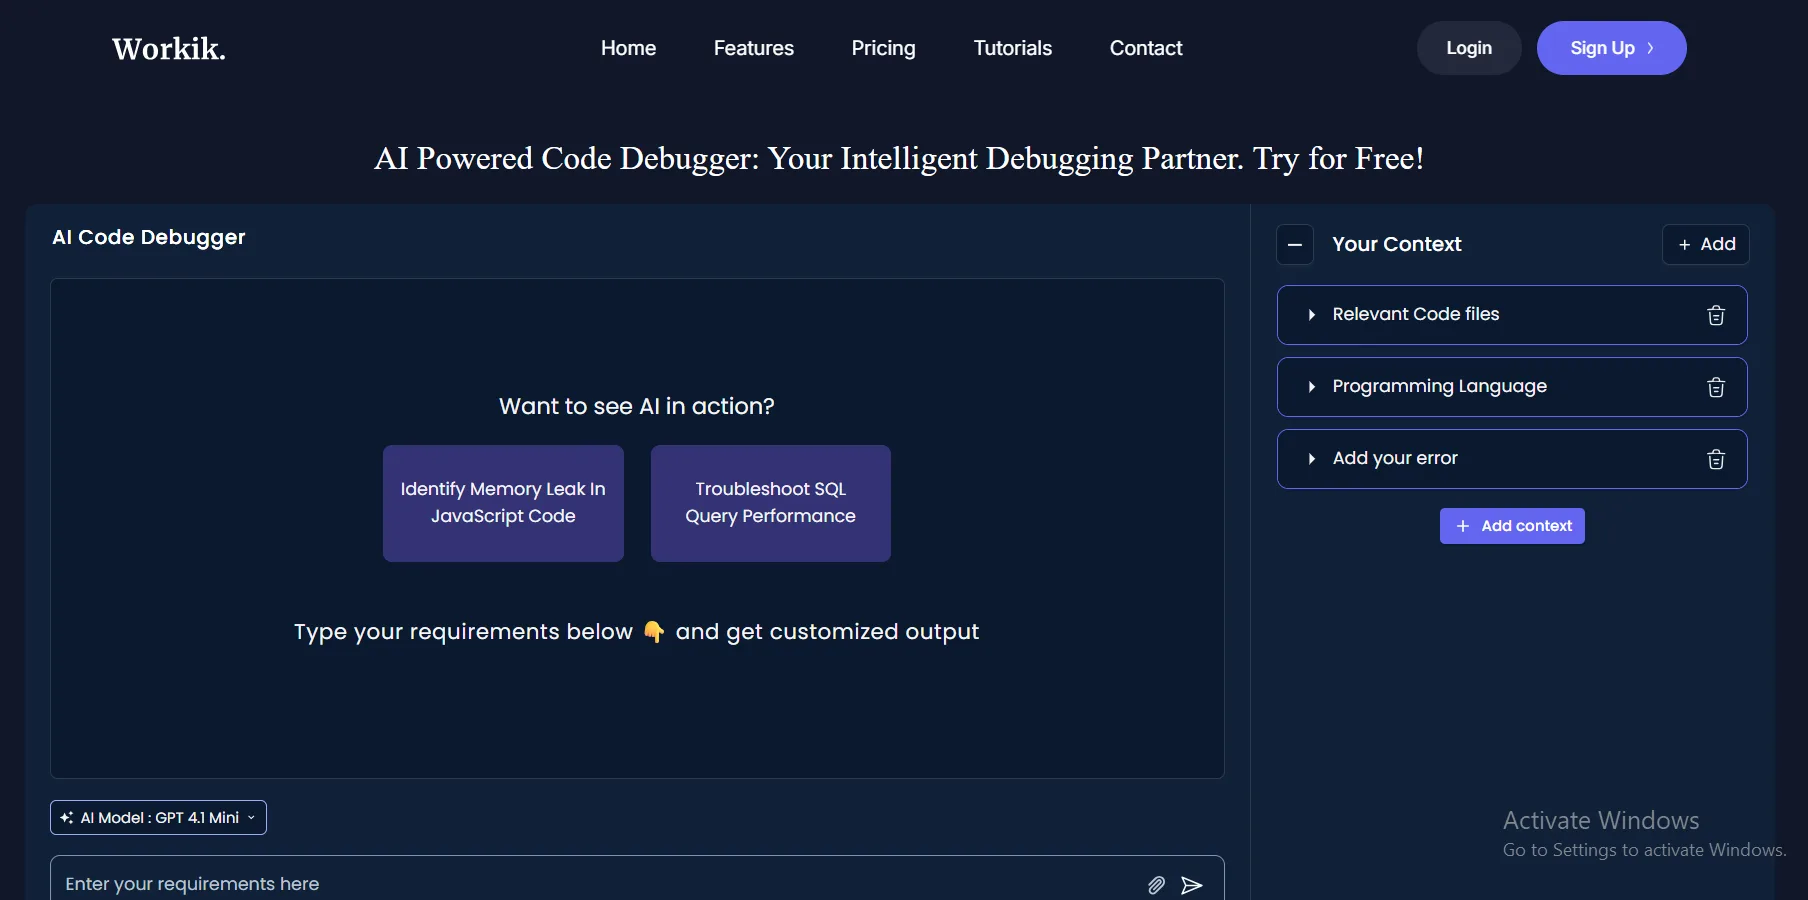
Purpose: Streamlines error tracking and resolution in complex codebases.
Key Features:
- Context-aware error detection for syntax and runtime issues.
- Automated test case generation to catch bugs early.
- Performance profiling to identify bottlenecks.
- Collaborative workspaces for team debugging.
Benefits: Workik’s context-setting feature enhances debugging precision by understanding project-specific logic, reducing false positives. It’s ideal for full-stack developers working on microservices.
Ease of Use: Intuitive interface with a moderate learning curve; best for developers familiar with IDE plugins.
Integration: Supports VS Code, IntelliJ, and PyCharm via plugins. Compatible with GitHub for DevOps pipelines.
Pricing Model: Freemium; free tier includes basic debugging, with premium plans starting at $10/month for advanced features.
Real-World Application: A DevOps team uses Workik to debug a Node.js microservice, identifying an inter-service communication issue at a breakpoint, saving hours of manual tracing.
Pros:
- Excellent for microservices and collaborative debugging.
- Strong automation for testing and optimization. Cons:
- Premium features can be costly for startups.
- Limited support for niche languages like Rust.
Workik AI Debugger
“Workik’s AI has transformed how we approach debugging, making it faster and more collaborative.” – Priya Sharma, DevOps Engineer at CodeZap
2. DeepCode

Purpose: Provides real-time code analysis and breakpoint suggestions.
Key Features:
- Semantic code analysis for precise error detection.
- Suggestions for optimizing code at breakpoints.
- Integration with CI/CD pipelines for automated debugging.
- Supports multiple languages (Python, Java, JavaScript).
Benefits: DeepCode’s semantic analysis ensures high debugging precision, catching issues traditional tools miss. It’s suited for teams using continuous integration.
Ease of Use: Easy to set up with minimal configuration; ideal for beginners and pros.
Integration: Works with GitHub, GitLab, and Bitbucket. Plugins available for VS Code and IntelliJ.
Pricing Model: Free for open-source projects; enterprise plans start at $15/month.
Real-World Application: A Python developer uses DeepCode to debug a machine learning script, identifying an inefficient loop at a breakpoint, improving runtime by 20%.
Pros:
- Free for open-source projects.
- Broad language support. Cons:
- Enterprise pricing can be steep for small teams.
- Limited offline capabilities.
DeepCode
3. CodiumAI
Purpose: Enhances code reliability through AI-driven breakpoint analysis.
Key Features:
- Generates unit tests to validate breakpoints.
- Suggests code fixes based on error patterns.
- Interactive code review for team collaboration.
- Supports TypeScript, Python, and Go.
Benefits: CodiumAI’s test generation ensures robust code,руса
Ease of Use: User-friendly; ideal for developers new to AI tools.
Integration: Compatible with VS Code, Eclipse, and JetBrains IDEs.
Pricing Model: Freemium; premium features at $12/month.
Real-World Application: A TypeScript developer uses CodiumAI to debug a frontend app, catching a null pointer issue at a breakpoint with an automated test case.
Pros:
- Strong test generation capabilities.
- Affordable premium plan. Cons:
- Limited support for legacy codebases.
- Slower analysis for large projects.
CodiumAI
4. Bugfender
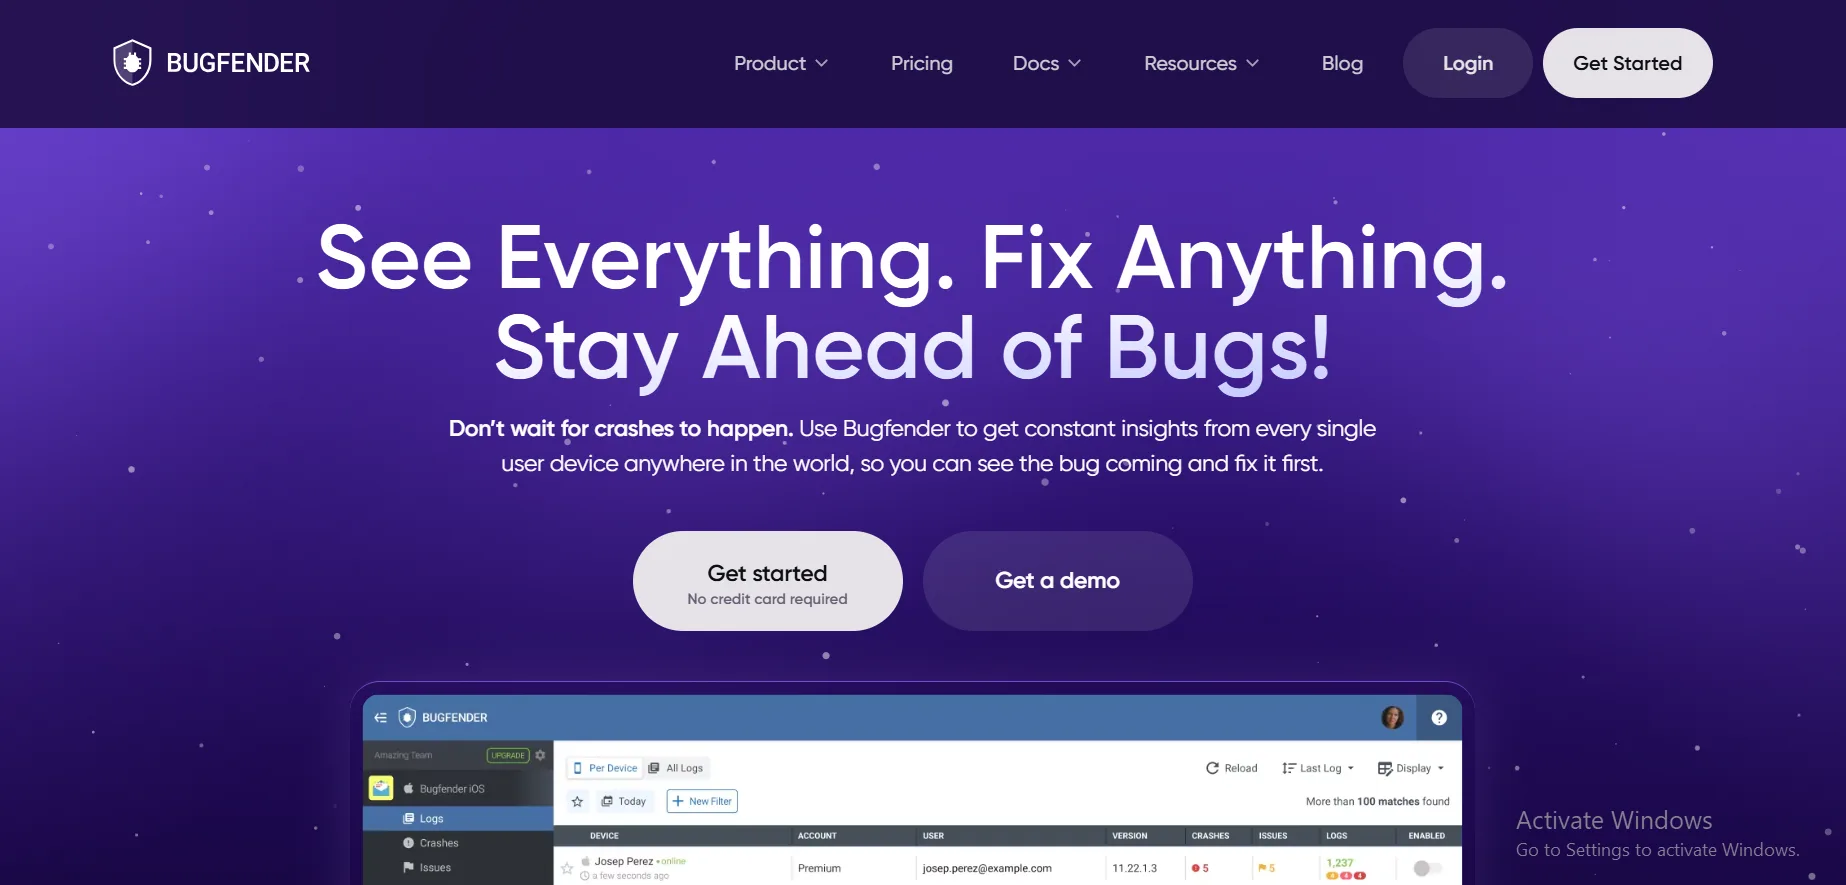
Purpose: Focuses on real-time debugging for mobile and web apps.
Key Features:
- Live log analysis at breakpoints.
- Crash reporting and performance monitoring.
- AI-driven insights for error prioritization.
- Remote debugging capabilities.
Benefits: Bugfender excels in mobile app debugging, offering real-time insights that reduce downtime.
Ease of Use: Moderate learning curve; requires setup for remote debugging.
Integration: Supports Android Studio, Xcode, and VS Code.
Pricing Model: Subscription-based, starting at $29/month.
Real-World Application: A mobile developer uses Bugfender to debug an iOS app crash, identifying a memory issue at a breakpoint in minutes.
Pros:
- Excellent for mobile and web apps.
- Robust crash reporting. Cons:
- Higher cost compared to competitors.
- Limited free tier.
Bugfender
5. Rookout
Purpose: Enables non-intrusive breakpoint debugging for production code.
Key Features:
- Live debugging without code changes.
- AI-powered issue prioritization.
- Real-time data collection at breakpoints.
- Supports Java, Python, and Node.js.
Benefits: Rookout’s non-intrusive approach minimizes workflow disruption, ideal for production environments.
Ease of Use: Advanced setup; best for experienced developers.
Integration: Integrates with AWS, Azure, and Kubernetes.
Pricing Model: Subscription-based, starting at $50/month.
Real-World Application: A cloud engineer uses Rookout to debug a Kubernetes pod, resolving a runtime error without redeploying.
Pros:
- Ideal for production debugging.
- Strong cloud integration. Cons:
- Expensive for small teams.
- Steep learning curve.
Rookout
6. Sentry
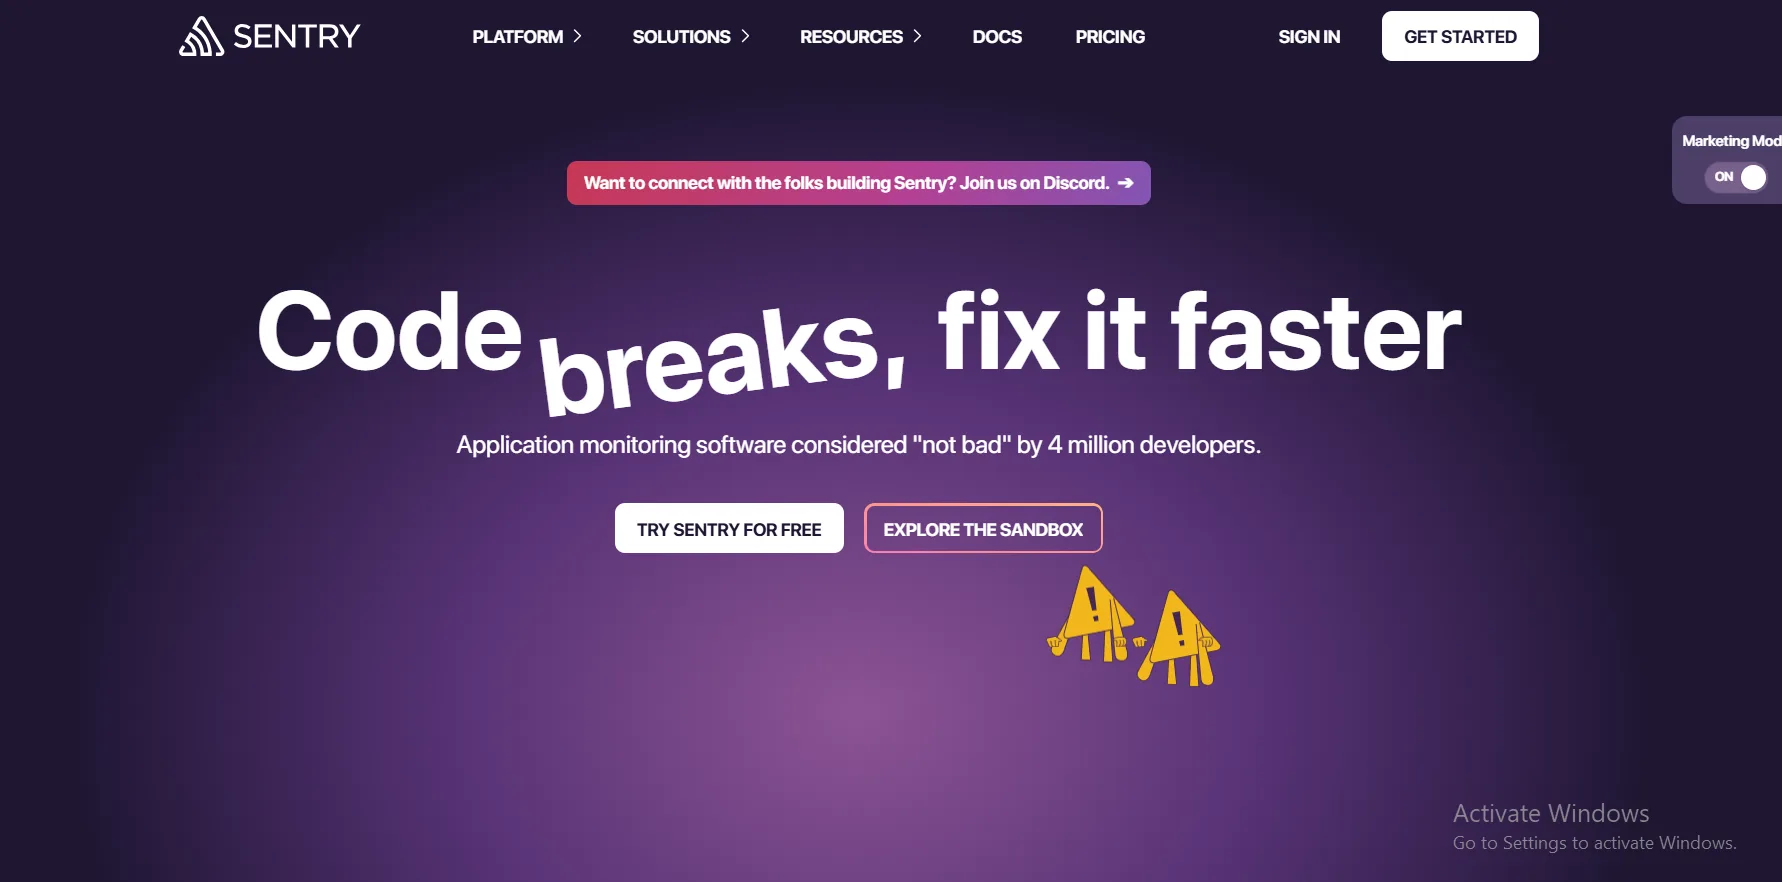
Purpose: Provides error tracking and breakpoint analysis for web apps.
Key Features:
- Real-time error tracking.
- AI-driven error grouping and prioritization.
- Performance monitoring for slow breakpoints.
- Supports multiple frameworks (React, Django).
Benefits: Sentry’s error grouping simplifies debugging complex web apps, saving time.
Ease of Use: Easy to use with clear documentation.
Integration: Works with VS Code, GitHub, and Slack.
Pricing Model: Freemium; premium plans start at $26/month.
Real-World Application: A React developer uses Sentry to debug a performance bottleneck, identifying a slow API call at a breakpoint.
Pros:
- Strong web app support.
- Affordable pricing. Cons:
- Limited mobile app support.
- Advanced features require premium plan.
Sentry
7. CodeSee
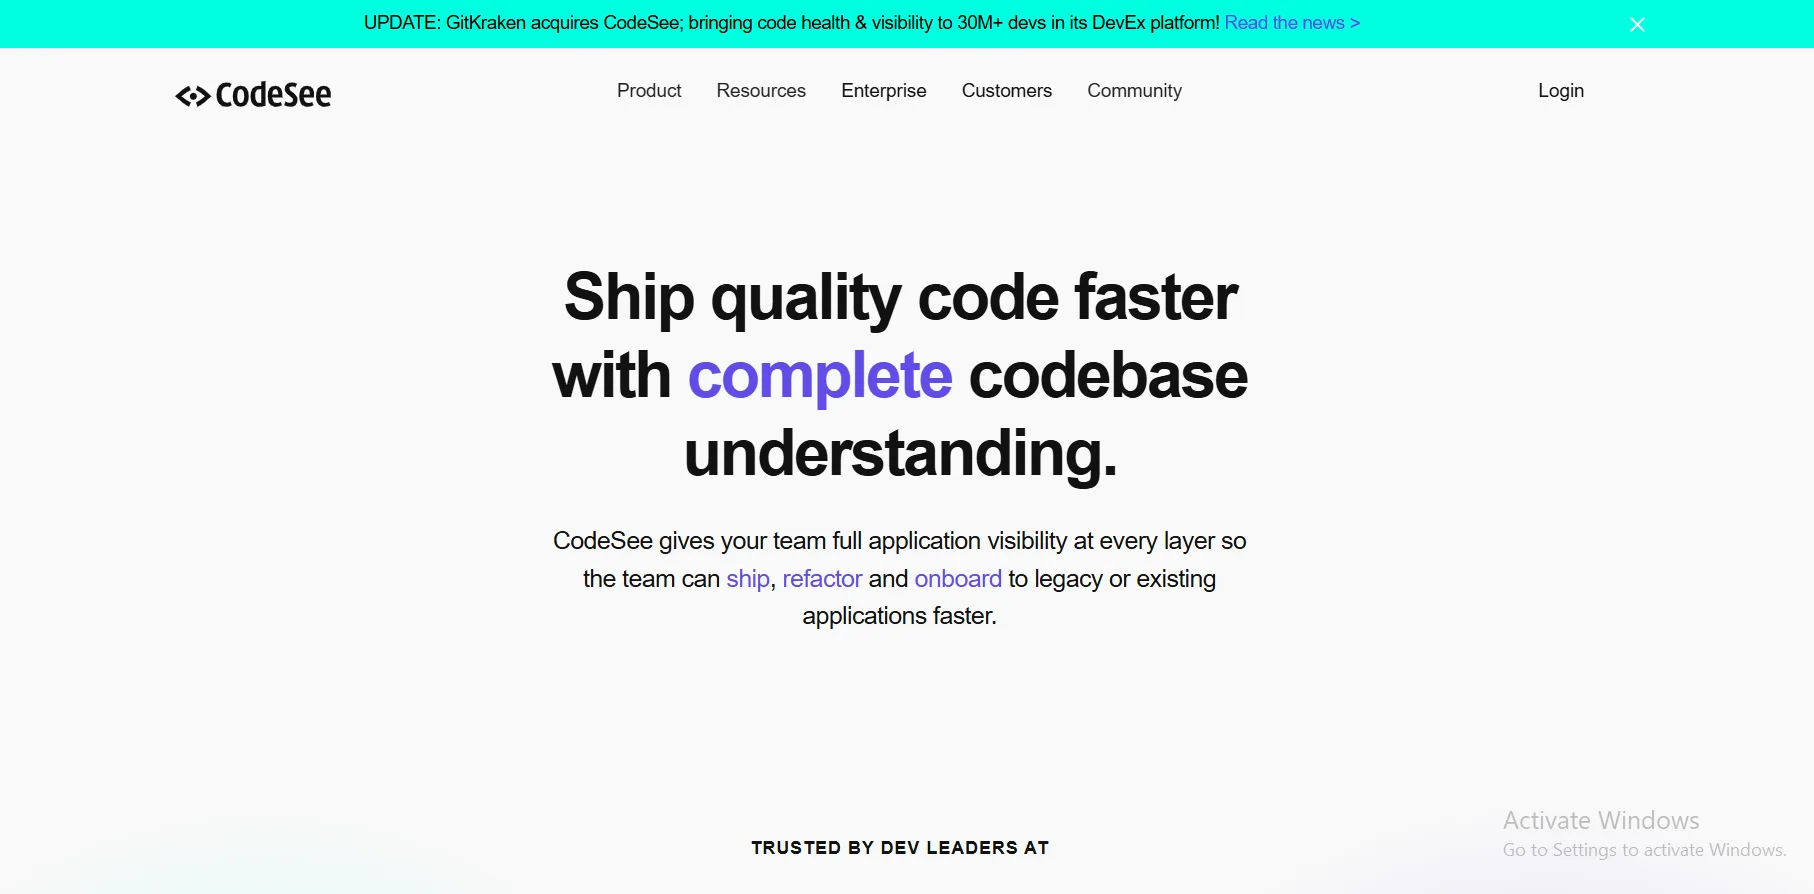
Purpose: Visualizes code execution for easier breakpoint debugging.
Key Features:
- Codebase visualization at breakpoints.
- AI-driven error detection and suggestions.
- Collaboration tools for team debugging.
- Supports JavaScript, TypeScript, and Python.
Benefits: CodeSee’s visualization helps developers understand complex code flows, improving debugging precision.
Ease of Use: Highly intuitive; great for visual learners.
Integration: Integrates with VS Code and GitHub.
Pricing Model: Freemium; premium plans start at $15/month.
Real-World Application: A JavaScript developer uses CodeSee to visualize a buggy function, pinpointing a logic error at a breakpoint.
Pros:
- Visual debugging enhances clarity.
- Affordable for small teams. Cons:
- Limited language support.
- Visualization can be slow for large codebases.
CodeSee
“AI debugging tools like CodeSee make complex codebases feel like open books.” – James Lee, CTO at InnovateTech
AI Tool Comparison
Table 1: Feature Comparison of AI Debugging Assistants
| Tool | Key Features | Languages Supported | IDE Integration | Best For |
|---|---|---|---|---|
| Workik | Error detection, test generation | Python, Java, JavaScript | VS Code, IntelliJ, PyCharm | Microservices, DevOps |
| DeepCode | Semantic analysis, CI/CD integration | Python, Java, JavaScript | VS Code, IntelliJ, GitHub | Open-source, CI/CD teams |
| CodiumAI | Test generation, code review | TypeScript, Python, Go | VS Code, Eclipse, JetBrains | Unit testing, collaboration |
| Bugfender | Live logs, crash reporting | Mobile/web languages | Android Studio, Xcode, VS Code | Mobile/web apps |
| Rookout | Non-intrusive debugging | Java, Python, Node.js | AWS, Azure, Kubernetes | Production debugging |
| Sentry | Error tracking, performance monitoring | React, Django, others | VS Code, GitHub, Slack | Web apps |
| CodeSee | Code visualization, collaboration | JavaScript, TypeScript | VS Code, GitHub | Visual debugging, teams |
Table 2: Pricing and Ease of Use Comparison

| Tool | Pricing (Starting) | Free Tier | Ease of Use (1-5) | Learning Curve |
|---|---|---|---|---|
| Workik | $10/month | Yes | 4 | Moderate |
| DeepCode | $15/month | Yes | 5 | Low |
| CodiumAI | $12/month | Yes | 5 | Low |
| Bugfender | $29/month | No | 3 | Moderate |
| Rookout | $50/month | No | 2 | High |
| Sentry | $26/month | Yes | 4 | Low |
| CodeSee | $15/month | Yes | 5 | Low |
Ethical Considerations and Best Practices
Using AI debugging assistants for breakpoints raises ethical considerations:
- Data Privacy: Ensure tools comply with GDPR, CCPA, or local Nigerian data protection laws when handling sensitive code.
- Over-Reliance: AI suggestions may be incorrect; always verify fixes to avoid introducing new bugs.
- Bias in AI Models: AI trained on biased datasets may overlook niche language issues. Use diverse training data when possible.
Best Practices:
- Regularly review AI suggestions against project requirements.
- Combine AI tools with traditional debugging skills like stack trace analysis.
- Use tools with transparent data policies to protect intellectual property.
“Ethical AI use in debugging requires a balance of automation and human oversight to ensure trust and accuracy.” – Dr. Amina Bello, AI Ethics Researcher
Empowering Developers with AI Debugging
AI debugging assistants for breakpoints are transforming how developers tackle code issues, offering precision, speed, and context-aware solutions. By integrating tools like Workik, DeepCode, or Sentry into your workflow, you can reduce debugging time, enhance code quality, and meet tight deadlines with confidence. For startups in Nigeria or elsewhere, cost-effective options like DeepCode and CodiumAI provide powerful features without breaking the bank. Explore these tools today to streamline your debugging process and elevate your development game.
“The future of debugging lies in AI’s ability to amplify human expertise, not replace it.” – Tolu Adebayo, Software Developer at Lagos Tech Hub
Frequently Asked Questions
What is an AI debugging assistant for breakpoints?
An AI debugging assistant for breakpoints uses machine learning to analyze code at specific execution points, identifying errors and suggesting fixes with high precision.
How do AI debugging tools improve developer productivity?
These tools automate error detection, provide context-aware suggestions, and reduce manual debugging time, allowing developers to focus on coding.
Are AI debugging assistants secure for sensitive code?
Most tools offer secure data handling, but developers should choose tools compliant with data privacy laws like GDPR and verify encryption protocols.
Which AI debugging tool is best for startups?
DeepCode and CodiumAI are cost-effective with free tiers, making them ideal for startups needing robust debugging without high costs.
Can AI debugging tools handle complex codebases?
Yes, tools like Workik and Rookout excel in complex environments like microservices and production systems, offering precise breakpoint analysis.


