For developers, maintaining legacy code is like navigating a maze blindfolded—complex, error-prone, and time-consuming. Outdated systems, written in languages like COBOL or early Java, often lack documentation, harbor hidden bugs, and resist modern updates. These challenges drain productivity, inflate maintenance costs, and frustrate teams striving to meet modern demands. This article explores how legacy code with AI debugging assistants transforms these pain points into opportunities, offering practical, AI-driven solutions to modernize old systems efficiently.
Overcoming the Legacy Code Challenge with AI
Why use AI debugging assistants for legacy code? AI debugging assistants streamline error detection, suggest code improvements, and automate testing, saving developers hours on legacy system maintenance.
By leveraging AI modernization solutions, developers can breathe new life into aging codebases, ensuring they remain functional and competitive. Let’s dive into the challenges, solutions, and top tools reshaping legacy code maintenance in 2025.
Understanding the Developer’s Legacy Code Pain Points
Legacy code—often decades old—presents unique hurdles for developers:
- Obscure Bugs: Undocumented code hides errors that surface only during runtime, delaying projects.
- Performance Bottlenecks: Outdated algorithms or inefficient structures slow down applications.
- Integration Issues: Legacy systems struggle to integrate with modern APIs or microservices architectures.
- Lack of Test Coverage: Many old systems lack unit tests, making updates risky and error-prone.
- Knowledge Gaps: Original developers may no longer be available, leaving teams to decipher cryptic code.
These issues lead to prolonged debugging cycles, increased technical debt, and missed deadlines. For example, a financial institution maintaining a COBOL-based banking system might spend weeks tracing a single bug, impacting customer-facing services. The ripple effect? Frustrated teams, escalating costs, and delayed innovation.
“Legacy code is a silent productivity killer, but AI tools are revolutionizing how we tackle these systems, making them manageable and even future-proof.” – Dr. Jane Miller, Software Engineering Consultant
How AI Debugging Assistants Solve Legacy Code Challenges
AI debugging assistants empower developers to address legacy code pain points with precision. Here’s a step-by-step guide to integrating these tools into your workflow:
How to Debug Legacy Code with AI Debugging Assistants
- Analyze Code Context: Configure the AI tool with project-specific details like language, framework, and database schema.
- Run Automated Error Detection: Use the tool to scan for syntax errors, runtime issues, or memory leaks.
- Review AI Suggestions: Evaluate AI-generated fixes or refactoring suggestions for accuracy and relevance.
- Implement Automated Tests: Generate unit tests to validate changes and ensure code reliability.
- Optimize Performance: Apply AI-driven profiling to identify and resolve bottlenecks.
- Integrate with IDEs: Sync the tool with your IDE (e.g., VS Code, IntelliJ) for real-time debugging support.
These steps streamline workflows, reduce manual effort, and enhance code quality. For instance, a developer working on a legacy Python Flask application can use an AI tool to detect inefficient database queries, suggest optimizations, and generate tests to prevent regressions.
“AI debugging tools don’t just fix bugs—they empower developers to understand and improve legacy systems systematically.” – Michael Chen, Lead Developer at TechTrend Innovations
Unbiased Reviews of 5 Top AI Debugging Assistants for Legacy Code
Below, we review five leading legacy debugging tools that excel in modernizing old systems. Each tool is evaluated for its purpose, features, benefits, ease of use, integration, pricing, and real-world application, with pros and cons for balanced insight.
1. Workik AI
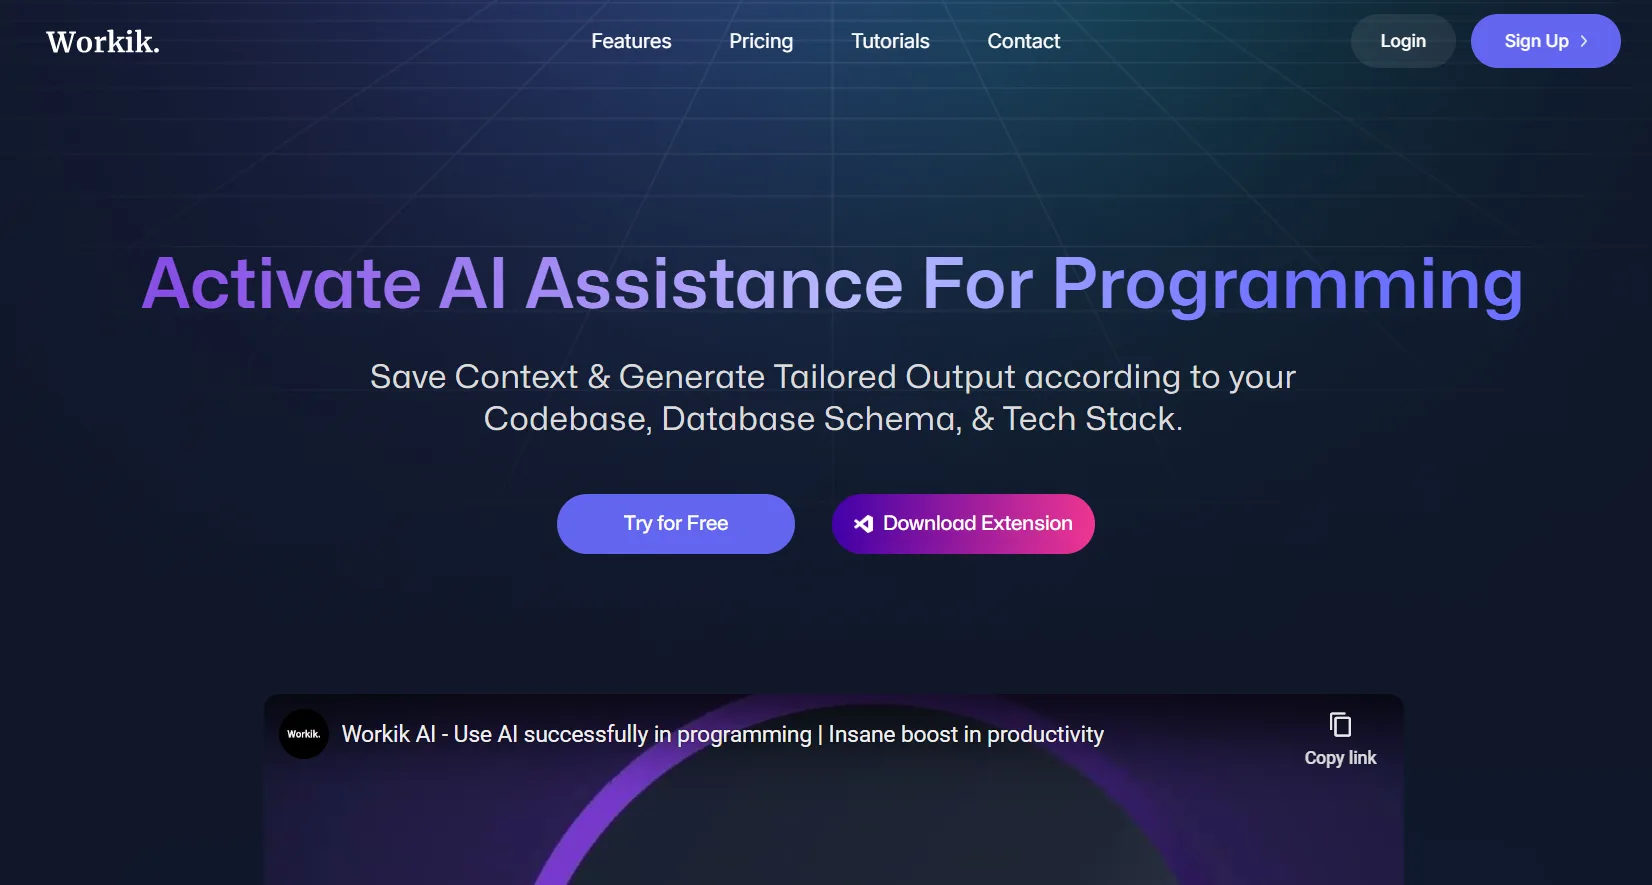
Purpose: Workik AI specializes in context-aware debugging, ideal for legacy systems in Python, Java, and microservices architectures.
Key Features:
- Error detection for syntax and runtime issues.
- Performance profiling to identify bottlenecks.
- Automated test case generation.
- Context-setting for frameworks (e.g., Django, Flask) and databases (e.g., PostgreSQL).
- Version control integration with GitHub, GitLab, and Bitbucket.
Benefits: Saves time by automating repetitive debugging tasks and ensures high code quality through testing.
Ease of Use: Intuitive interface with minimal setup; ideal for developers familiar with Git workflows.
Integration: Seamlessly integrates with VS Code, PyCharm, and IntelliJ IDEA.
Pricing Model: Freemium; advanced features like memory profiling require a paid plan (details at Workik AI).
Real-World Application: A DevOps engineer upgrading a legacy Django app can use Workik to detect memory leaks, optimize database queries, and automate testing before deployment.
Pros:
- Context-aware debugging tailors solutions to specific project needs.
- Strong support for Python and microservices.
- Scalable for large codebases.
Cons:
- Limited support for non-mainstream languages like COBOL.
- Advanced features locked behind a paywall.
2. Qodo (formerly CodiumAI)
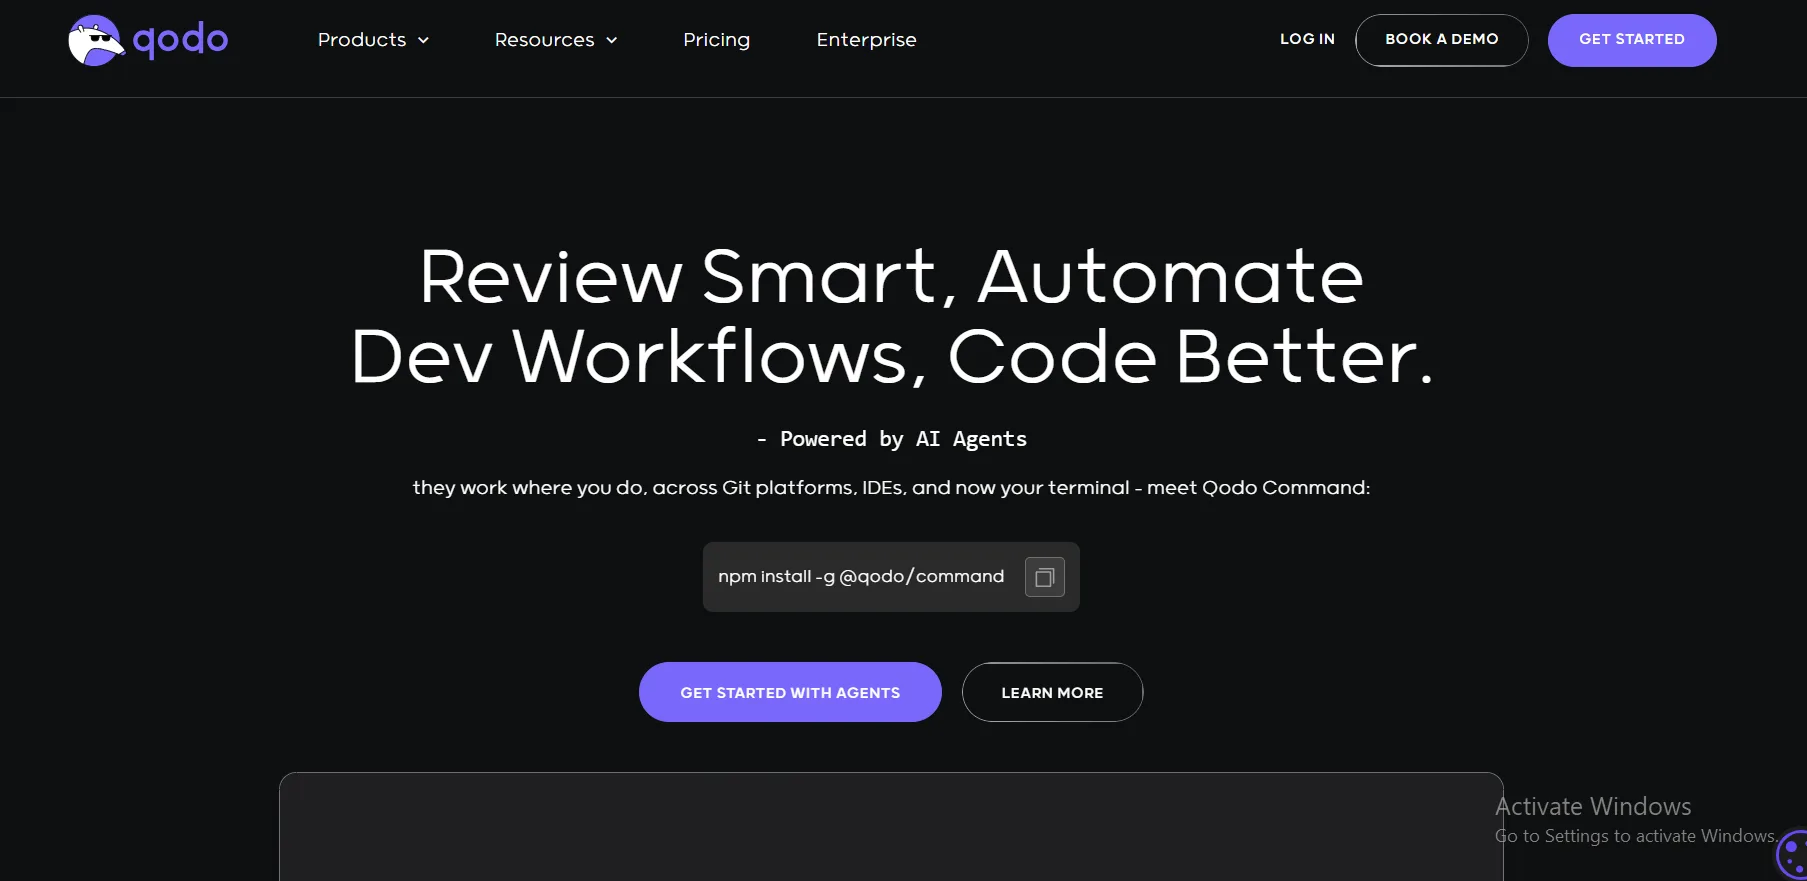
Purpose: Qodo focuses on code generation, debugging, and pull request reviews, making it suitable for legacy code refactoring.
Key Features:
- Code suggestions for fixing bugs and optimizing code.
- Automated test generation for legacy systems.
- Pull request analysis with commands like
/reviewand/improve. - IDE integration with VS Code and JetBrains.
Benefits: Enhances collaboration by streamlining pull request reviews and improves code reliability with tests.
Ease of Use: User-friendly, with commands accessible directly in IDEs; slight learning curve for non-technical users.
Integration: Compatible with VS Code, IntelliJ, and GitHub workflows.
Pricing Model: Free plan for individual developers; premium features in paid Team plan (details at Qodo).
Real-World Application: A software engineer refactoring a Java-based legacy system can use Qodo to generate unit tests and optimize code during pull requests.
Pros:
- Comprehensive pull request analysis.
- Free plan includes robust features.
- Strong test generation capabilities.
Cons:
- Limited test coverage for complex codebases.
- Paid plan required for team collaboration features.
3. Rubberduck
Purpose: Rubberduck is a VS Code extension designed for AI-assisted refactoring and test generation in legacy codebases.
Key Features:
- Code simplification and refactoring suggestions.
- Test generation for frameworks like Mocha and pytest.
- Real-time debugging within VS Code.
- Follow-up query support for refining suggestions.
Benefits: Speeds up refactoring by providing actionable insights and reduces analysis paralysis.
Ease of Use: Plug-and-play for VS Code users; minimal setup required.
Integration: Exclusive to VS Code; limited support for other IDEs.
Pricing Model: Free with optional premium features (details at Rubberduck).
Real-World Application: A developer maintaining a JavaScript Express app can use Rubberduck to generate Mocha tests and refactor controllers without external database calls.
Pros:
- Seamless VS Code integration.
- Free with robust features.
- Iterative suggestion refinement.
Cons:
- Limited to VS Code, reducing flexibility.
- Slower response times (~10 seconds) for complex queries.
4. GitHub Copilot

Purpose: GitHub Copilot excels in code completion and debugging assistance, supporting legacy code updates across multiple languages.
Key Features:
- Real-time code suggestions and error fixes.
- Pull request description generation.
- Code explanation for understanding legacy functions.
- IDE integration with VS Code, IntelliJ, and more.
Benefits: Accelerates coding by suggesting fixes and explanations, ideal for legacy systems with poor documentation.
Ease of Use: Intuitive for developers already using GitHub; minimal setup.
Integration: Works with VS Code, IntelliJ, and GitHub Codespaces.
Pricing Model: Freemium; advanced features in paid Team plan (details at GitHub Copilot).
Real-World Application: A developer working on a legacy TypeScript project can use Copilot to explain obscure functions and suggest optimizations during code reviews.
Pros:
- Broad language support (Python, Java, TypeScript, etc.).
- Seamless GitHub integration.
- Enhances understanding of unfamiliar code.
Cons:
- Limited test case generation for large codebases.
- Premium features require a paid plan.
5. Zentara-Code
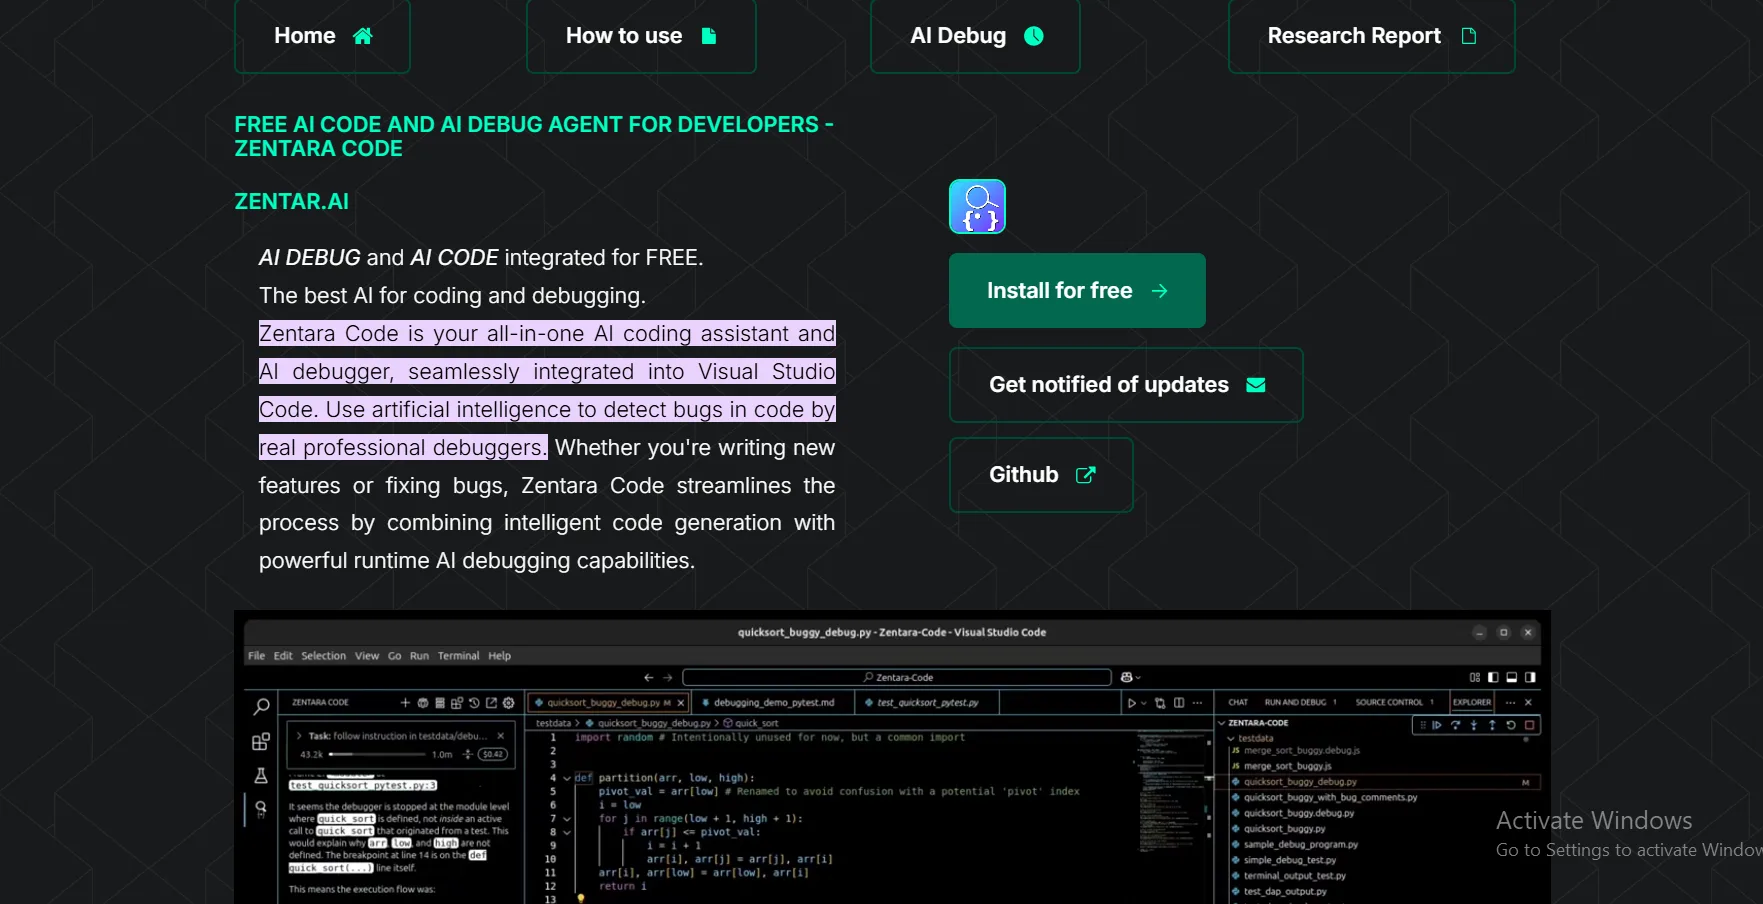
Purpose: Zentara-Code offers runtime debugging and stack inspection, tailored for C# and other niche environments.
Key Features:
- Runtime debugging with stack frame analysis.
- Code suggestions for error resolution.
- Performance optimization insights.
Benefits: Ideal for developers in specialized environments like C# legacy systems, improving debugging accuracy.
Ease of Use: Moderate learning curve due to focus on runtime debugging; best for experienced developers.
Integration: Compatible with Visual Studio and VS Code.
Pricing Model: Open-source with optional paid support (details at Zentara-Code).
Real-World Application: A C# developer maintaining a legacy .NET application can use Zentara-Code to inspect stack variables and resolve runtime errors.
Pros:
- Strong runtime debugging capabilities.
- Open-source with community support.
- Tailored for C# environments.
Cons:
- Limited support for non-C# languages.
- Requires familiarity with runtime debugging concepts.
AI Tool Comparison: Which Tool Suits Your Legacy Code Needs?
To help you choose the right AI code error fixer, we’ve compared the five tools across key criteria. These tables are designed for quick scanning and featured snippet potential.
Table 1: Feature Comparison of AI Debugging Assistants
| Tool | Error Detection | Test Generation | IDE Integration | Performance Profiling | Legacy Language Support |
|---|---|---|---|---|---|
| Workik AI | Yes | Yes | VS Code, PyCharm, IntelliJ | Yes | Python, Java, JavaScript |
| Qodo | Yes | Yes | VS Code, JetBrains, GitHub | Limited | Python, Java, TypeScript, Ruby |
| Rubberduck | Yes | Yes | VS Code | No | JavaScript, Python |
| GitHub Copilot | Yes | Limited | VS Code, IntelliJ, GitHub | No | Python, Java, TypeScript, Rust |
| Zentara-Code | Yes | No | Visual Studio, VS Code | Yes | C#, limited others |
Ethical Considerations and Best Practices
When using AI modernization solutions, developers must prioritize ethical practices:
- Data Privacy: Ensure tools comply with GDPR or CCPA, especially when handling sensitive legacy code in industries like finance or healthcare.
- Transparency: Verify that AI suggestions are logged and auditable to maintain accountability.
- Bias Mitigation: Avoid over-reliance on AI suggestions, as they may not fully grasp legacy system nuances.
- Best Practice: Combine AI tools with human oversight to validate changes, especially in critical systems.
“Ethical AI use in debugging means balancing automation with human judgment to ensure trust and reliability.” – Dr. Emily Wong, AI Ethics Researcher
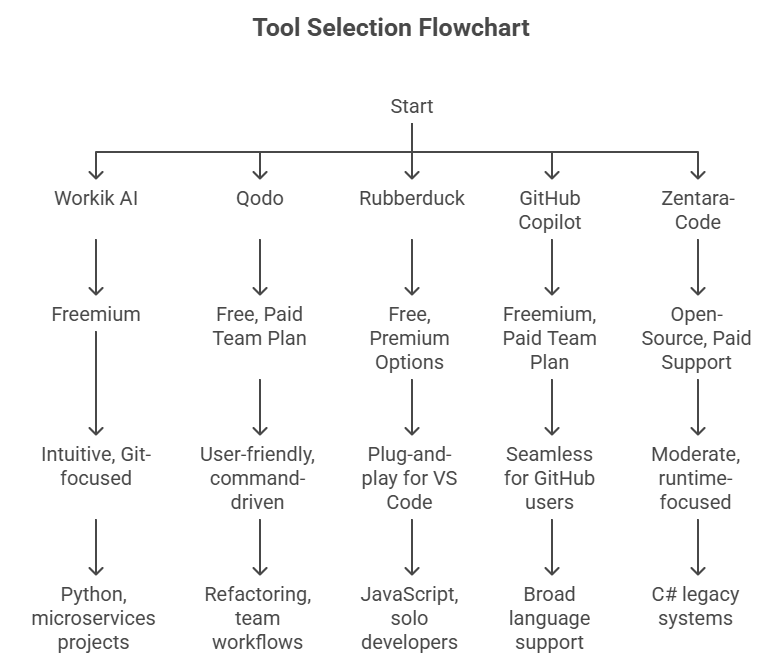
Table 2: Pricing and Ease of Use Comparison
| Tool | Pricing Model | Ease of Use | Best For |
|---|---|---|---|
| Workik AI | Freemium | Intuitive, Git-focused | Python, microservices projects |
| Qodo | Free, Paid Team Plan | User-friendly, command-driven | Refactoring, team workflows |
| Rubberduck | Free, Premium Options | Plug-and-play for VS Code | JavaScript, solo developers |
| GitHub Copilot | Freemium, Paid Team Plan | Seamless for GitHub users | Broad language support |
| Zentara-Code | Open-Source, Paid Support | Moderate, runtime-focused | C# legacy systems |
“Choosing the right AI debugging tool depends on your codebase’s language and team’s workflow—context is everything.” – Sarah Patel, CTO at CodeSync Solutions
Transform Legacy Code with AI Debugging Assistants
Maintaining legacy code with AI debugging assistants is no longer a daunting task. Tools like Workik AI, Qodo, Rubberduck, GitHub Copilot, and Zentara-Code empower developers to detect errors, optimize performance, and modernize systems efficiently. By integrating these legacy debugging tools into your workflow, you can reduce technical debt, enhance productivity, and deliver reliable software. Explore these tools today to transform your legacy code challenges into opportunities for innovation.
“In 2025, AI debugging assistants are the key to unlocking the potential of legacy systems, making them agile and competitive.” – David Lee, Software Architect
Start with free plans from Qodo or Rubberduck to see immediate improvements in your legacy code maintenance!
Frequently Asked Questions (FAQs)
What is a legacy code with AI debugging assistant?
A legacy code with AI debugging assistant uses AI to detect errors, suggest fixes, and generate tests for outdated codebases, streamlining maintenance.
How do AI debugging tools improve legacy code maintenance?
AI tools automate error detection, optimize performance, and generate tests, reducing manual effort and enhancing code reliability for legacy systems.
Can AI debugging assistants handle COBOL or other old languages?
Some tools like GitHub Copilot support older languages, but specialized tools like Workik AI may have limited COBOL support.
Are AI debugging tools cost-effective for startups?
Yes, tools like Rubberduck and Qodo offer free plans, making them ideal for startups tackling legacy code on a budget.
How do I integrate AI debugging tools into my workflow?
Configure the tool with your codebase’s context, integrate it with your IDE, and use its error detection and test generation features.


